Scalable Post-Processing with Dask and xarray
Introduction
tl;dr

This post shows how to set up a Jupyter notebook on NCAR Cheyenne with
Dask and xarray to analyze ensemble simulation output from Parallel Analog Ensemble.

Parallel computing becomes increasingly popular as more scientific workflows have been deployed onto supercomputers. It is also much more accessible because of the various supercomputer platforms available, e.g. Comet and Stampede from XSEDE.
Among all the scientific workflows, ensemble simulation is an example that typically requires large amount of computation. The good news is we have many tools to parallelize ensemble simulation, the standard and well-known solution being MPI for parallelization on distributed-memory clusters. There is the C/C++ interface from OpenMPI and MPICH; there is the Python interface from mpi4py; there is the R interface from Rmpi. This is good because usually the ensemble simulation stage takes up most of the computation. The benefit of parallelization is abundant and most often outweighs the costs of possibly having to refactor the simulation code.
Yet, what about analysis and visualization? Ensemble simulations usually output tons of simulation results, for example, later in this post, 3.2 TB of ensemble simulation for hourly photovoltaic power generation in 2019 for the continental US. With the sheer amount of the simulation output, data analysis and visualization can also be computational expensive and even memory intensive. It is sometimes hard to just read the data because they are stored in multiple files or the data size exceeds the physical memory of your computer. On another hand, data analysis and visualization is a highly interactive and explorative process. We usually do not know the exact data to read and the exact figures to generate. As a result, code for data analysis and visualization is usually procedure-based and is changed quite often based on what we find interesting.
There are tools for interactive data analysis and visualization. Jupyter notebook is an amazing example, but it does not provide parallel computing capability. We desire the ability to directly analyze our data on supercomputers, without downloading the bulk of data and in parallel.
In this post, I document how I set up my analysis and visualization environment with parallel computing on a supercomputer, Cheyenne from NCAR CISL. This setup works great if your simulation data are stored with the NetCDF format, which is a quite popular format for high-dimensional labeled data built on top of HDF5.
This solution has the following features:
- The workflow is implemented in Python.
- The workflow is deployed directly on Cheyenne to avoid downloading the huge amount of data.
- Users interact with Jupyter Notebook for data analysis and visualization.
- Back-end computation is handled, in parallel, with xarray and Dask.
- Data can be stored in a single file or across multiple files.
Ensemble Simulation Data
This section provides a brief summary of the data I am going to work with. Feel free to skip this section if you only care about the setup procedures.
The simulation data I am going to use is generated from Parallel Analog Ensemble and Renewable Simulator. The goal is to generate a 21-member ensemble simulation for photovoltaic solar power production across the continental US for the entire year of 2019. The spatial resolution is 12 km and therefore, there are over 100,000 grid points to simulate.
The entire simulation output data are saved in NetCDF files, broken up in 30 spatial subsets. Please see the following shell command output.
cheyenne5:~/scratch/anen_solar_annual> du -ch *
110G	analogs_domain-USA_chunk-01.nc
110G	analogs_domain-USA_chunk-02.nc
[...]
110G	analogs_domain-USA_chunk-30.nc
3.2T	total
Each of the file has the year-round simulation results from 21 weather forecast ensemble members under 4 scenarios. These are hourly simulation with a high spatial resolution. Please see the following output that shows the structure of a particular NetCDF file.
cheyenne5:~/scratch/anen_solar_annual> ncdump -h analogs_domain-USA_chunk-01.nc
netcdf analogs_domain-USA_chunk-01 {
dimensions:
	num_stations = 3376 ;
	num_test_times = 365 ;
	num_flts = 27 ;
	num_analogs = 21 ;
	num_similarity = 21 ;
	num_parameters = 6 ;
	num_search_times = 710 ;
variables:
	double analogs_time_index(num_analogs, num_flts, num_test_times, num_stations) ;
	double similarity(num_similarity, num_flts, num_test_times, num_stations) ;
	double similarity_time_index(num_similarity, num_flts, num_test_times, num_stations) ;
	double weights(num_parameters) ;
	double Xs(num_stations) ;
	double Ys(num_stations) ;
	uint64 test_times(num_test_times) ;
	uint64 search_times(num_search_times) ;
	uint64 FLTs(num_flts) ;
	string ParameterNames(num_parameters) ;
	double WindSpeed_10m(num_analogs, num_flts, num_test_times, num_stations) ;
	double Temperature_2m(num_analogs, num_flts, num_test_times, num_stations) ;
	double DownwardShortwaveRadiation(num_analogs, num_flts, num_test_times, num_stations) ;
	double Albedo(num_analogs, num_flts, num_test_times, num_stations) ;

// global attributes:
		:num_analogs = 21 ;
		:num_similarity = 21 ;
		:observation_id = 0 ;
		:max_par_nan = 1 ;
		:max_flt_nan = 1 ;
		:flt_radius = 1 ;
		:operation = 1 ;
		:quick = 1 ;
		:prevent_search_future = 1 ;
		:Institute = "GEOlab @ Penn State" ;
		:Institute\ Link = "http://geolab.psu.edu" ;
		:Package = "Parallel Analog Ensemble" ;
		:Package\ Version = "v 4.2.5" ;
		:Package\ Link = "https://weiming-hu.github.io/AnalogsEnsemble" ;
		:Report\ Issues = "https://github.com/Weiming-Hu/AnalogsEnsemble/issues" ;

[...]
group: PV_simulation_scenario_00000 {
  dimensions:
  	single_member = 1 ;

  // group attributes:
  		:surface_tilt = 0LL ;
  		:surface_azimuth = 180LL ;
  		:tcell_model_parameters = "open_rack_glass_polymer" ;
  		:pv_module = "Silevo_Triex_U300_Black__2014_" ;

  group: analogs {
    variables:
    	double power(num_analogs, num_flts, num_test_times, num_stations) ;
    	double tcell(num_analogs, num_flts, num_test_times, num_stations) ;
    	double effective_irradiance(num_analogs, num_flts, num_test_times, num_stations) ;
    } // group analogs

  [...]
  } // group PV_simulation_scenario_00000

[...]
}
Environment Setup
Allocation on Cheyenne
It is assumed that you have an active allocation on Cheyenne. I will not be using Casper. Cheyenne will be sufficient for the documented solution.
Python Kernel for Jupiter Notebook
Jupyter needs a dedicated kernel to run code. To set up the environment, we need to
- Log onto a Cheyenne login node
- Activate a python environment
- Install additional modules we need for analysis and visualization
Please see the following code:
# This is the location of 'Python 3' kernel prepared by NCAR as the default option
source /ncar/usr/jupyterhub/20190905/bin/activate

# The following modules should already be installed.
# Install additional modules needed by your individual workflow.
#
# pip install dask[complete] dask_jobqueue xarray netCDF4
pip install matplotlib  # For generating scientific plots
pip install graphviz    # For generating computation graphs
To prepare an environment in user space, this approach might no longer work. Please see my more recent post on this matter here.
Interactive Session with NCAR JupyterHub
We then carry on to request interactive jobs from Cheyenne following the steps:
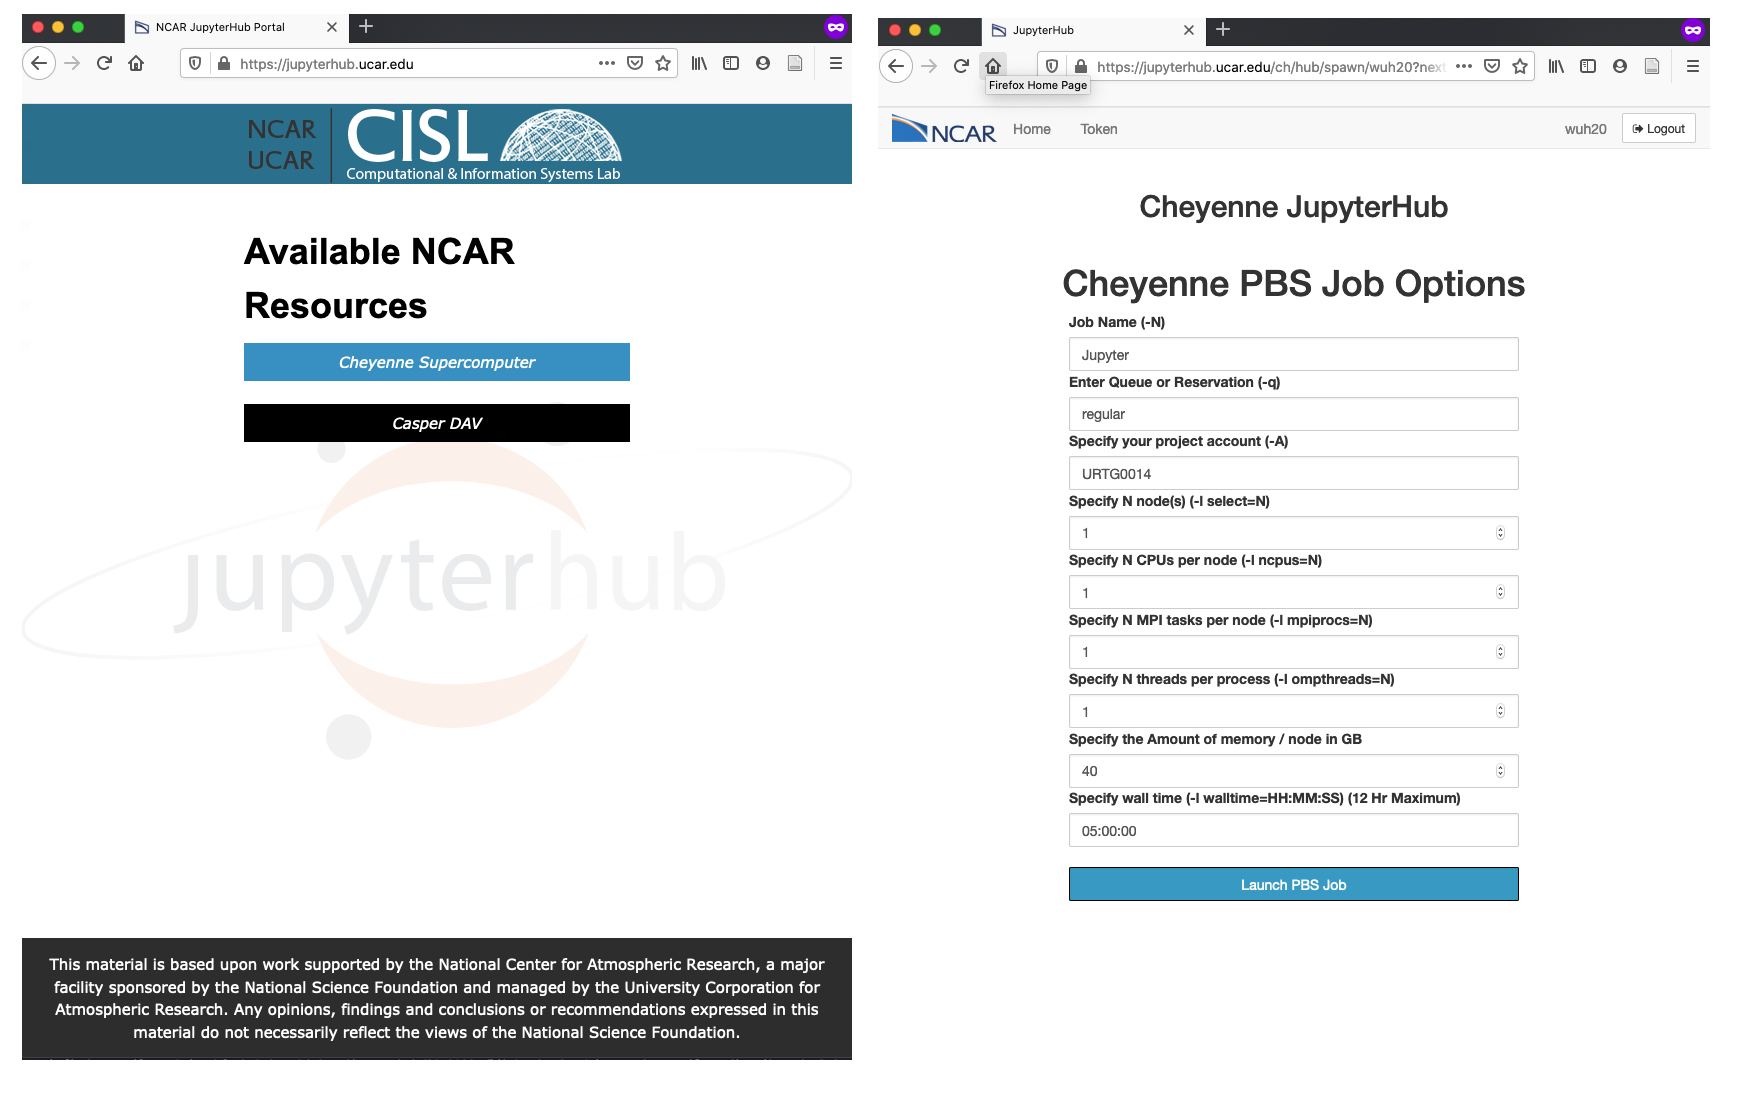
- Go to NCAR JupyterHub
- Select Cheyenne Supercomputer to use allocations on Cheyenne
- Sign in and select Launch Server
- Fill out the job request form. Note my choice of
regularfor the queue type. - Wait until you are redirected to your Jupyter notebook session
- Open a notebook with the
Python 3kernel (If you set up your own kernel, feel free to choose your own kernel.)

There is a second way of setting up a Jupyter notebook server on Cheyenne as illustrated here via SSH port forwarding. However, I did not find the integration of Dask dashboard with this second approach. So I would recommend using the web-based interface. Another advantage of the web-based interface is that the server is always live until you terminate the server explicitly or the allocationg runs out. This is very helpful when you have mediocre and intermittent internet connection.
Parallel Processing
At this point, your parallel computing environment is ready. In this section, I am going to show you how to read data from multiple NetCDF files and generate a quick plot, all in parallel.
Request Workers
In the previous section, we have only started an interactive job with one process. We need to request several workers that will actually do the heavy lifting. We do this by using a module called dask_jobqueue.
import dask_jobqueue

# Configure job requirements
cluster = dask_jobqueue.PBSCluster(
    cores=1, processes=1, memory="30GB", walltime='5:00:00',
    project='URTG0014', queue='regular',
)

# Request 10 workers
cluster.scale(10)
At this point, if you open another terminal to monitor your job status, you will see a few jobs added.
wuh20@r2i4n9:~> qstat -u wuh20
chadmin1.ib0.cheyenne.ucar.edu:
                                                            Req'd  Req'd   Elap
Job ID          Username Queue    Jobname    SessID NDS TSK Memory Time  S Time
--------------- -------- -------- ---------- ------ --- --- ------ ----- - -----
5180052.chadmin wuh20    regular  Jupyter     49297   1   1   40gb 05:00 R 00:07
5180066.chadmin wuh20    regular  dask-worke  41938   1   1    --  05:00 R 00:01
5180067.chadmin wuh20    regular  dask-worke  20567   1   1    --  05:00 R 00:01
5180069.chadmin wuh20    regular  dask-worke  13846   1   1    --  05:00 R 00:01
5180070.chadmin wuh20    regular  dask-worke  45562   1   1    --  05:00 R 00:01
5180071.chadmin wuh20    regular  dask-worke  41154   1   1    --  05:00 R 00:01
5180072.chadmin wuh20    regular  dask-worke  58037   1   1    --  05:00 R 00:01
5180073.chadmin wuh20    regular  dask-worke  49432   1   1    --  05:00 R 00:01
5180074.chadmin wuh20    regular  dask-worke  54128   1   1    --  05:00 R 00:01
5180075.chadmin wuh20    regular  dask-worke  46128   1   1    --  05:00 R 00:01
5180076.chadmin wuh20    regular  dask-worke  53090   1   1    --  05:00 R 00:01
Under the Jobname column, Jupyter is the interactive session we have manually requested from the web interface and dask-worker jobs are created by dask_jobqueue call. Now, all my workers are ready to go, indicated by the R for running under the S column for status.
Attach Clients
Now we have the resources ready, we need to specifically mark them as available and tell Dask to use these resources during parallel computation. Let’s create some clients.
import distributed
client = distributed.Client(cluster)
As of Feb. 7, 2021, the Dask dashboard on Cheyenne seems to have issues with displaying. I have opened a ticket about it and let’s see how it goes.
Open Files in Parallel
Finally, let’s open NetCDF files in parallel.
Normally, you would just need xarray.open_mfdataset as it opens and merges multiple NetCDF files, and returns a pretty HTML representation of the data structure. However, this post shows how to read NetCDF files generated from by PAnEn specifically. In order to successfully merge multiple files, we need to define a preprocess function as follows. Feel free to skip this function if you are reading your own data.
The following functions have been migrated to PyAnEn. Please check it out.
import re

from functools import partial

def add_coords(ds, arr_name, arr_axis):
    """
    This function adds coordinate information to an NetCDF file
    based on the NetCDF file name and the length of the specified
    dimension and variable. The coordinates will be created as simply
    some offset from the identifier from a file name.

    For example, if the file name is `analogs_domain-USA_chunk-01.nc` and
    there are 10 stations in this file, the coordinates for the station
    dimension will be calculated as `[1.0, 1.1, 1.2, ..., 1.9]`.

    :param ds The dataset object passed in internally by `xarray.open_mfdataset`
    :param arr_name The variable name
    :param arr_axis The axis index of the variable to determine coordinate length
    :return A modified dataset with coordinates
    """
    # Extract identifer from the file name.
    # This extracts all numeral digits immediately
    # before the file extension as the identifier.
    #
    matched = re.compile(r'.*chunk-(\d+)\.nc').search(ds.encoding["source"])
    assert matched is not None

    matched = matched.groups()
    assert len(matched) == 1

    start = int(matched[0])

    # Determine the length of coordinates in this file
    current_total = ds[arr_name].shape[arr_axis]

    # Calculate coordinates for this file
    station_coords = [start + index / current_total
                      for index in range(current_total)]

    # Add coordinates to the dataset
    ds.coords['num_stations'] = station_coords

    return ds

# Use the last dimension, the number of stations, of wind speed to
# determine the length of coordinates in this file
preprocess=preprocess = partial(
    add_coords, arr_name='WindSpeed_10m', arr_axis=3)
Then, let’s open the files in parallel.
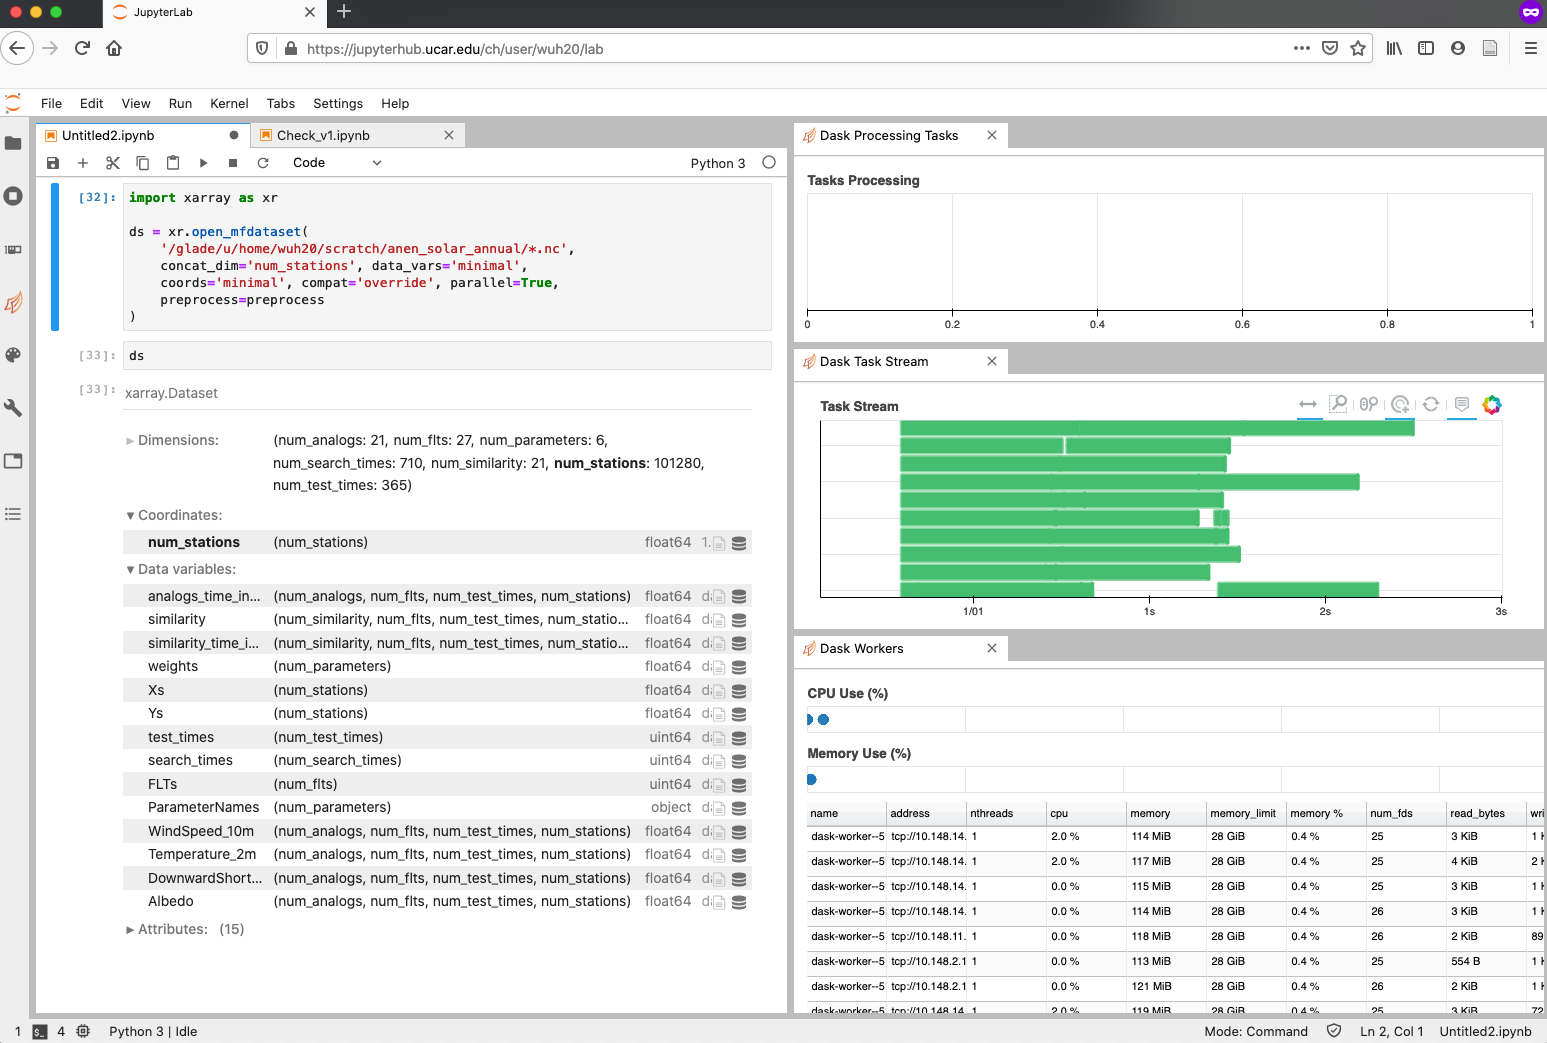
import xarray as xr

ds = xr.open_mfdataset(
    '/glade/u/home/wuh20/scratch/anen_solar_annual/*.nc',
    concat_dim='num_stations', data_vars='minimal',
    coords='minimal', compat='override', parallel=True,
    preprocess=preprocess
)

# For details of the arguments, please refer to the documentation
# http://xarray.pydata.org/en/stable/generated/xarray.open_mfdataset.html
At this point, all workers are opening files in parallel in the back-end. If you open Dask Task Stream and Dask Workers, you will notice some pretty progress bars showing up, as below.

Plot in Parallel
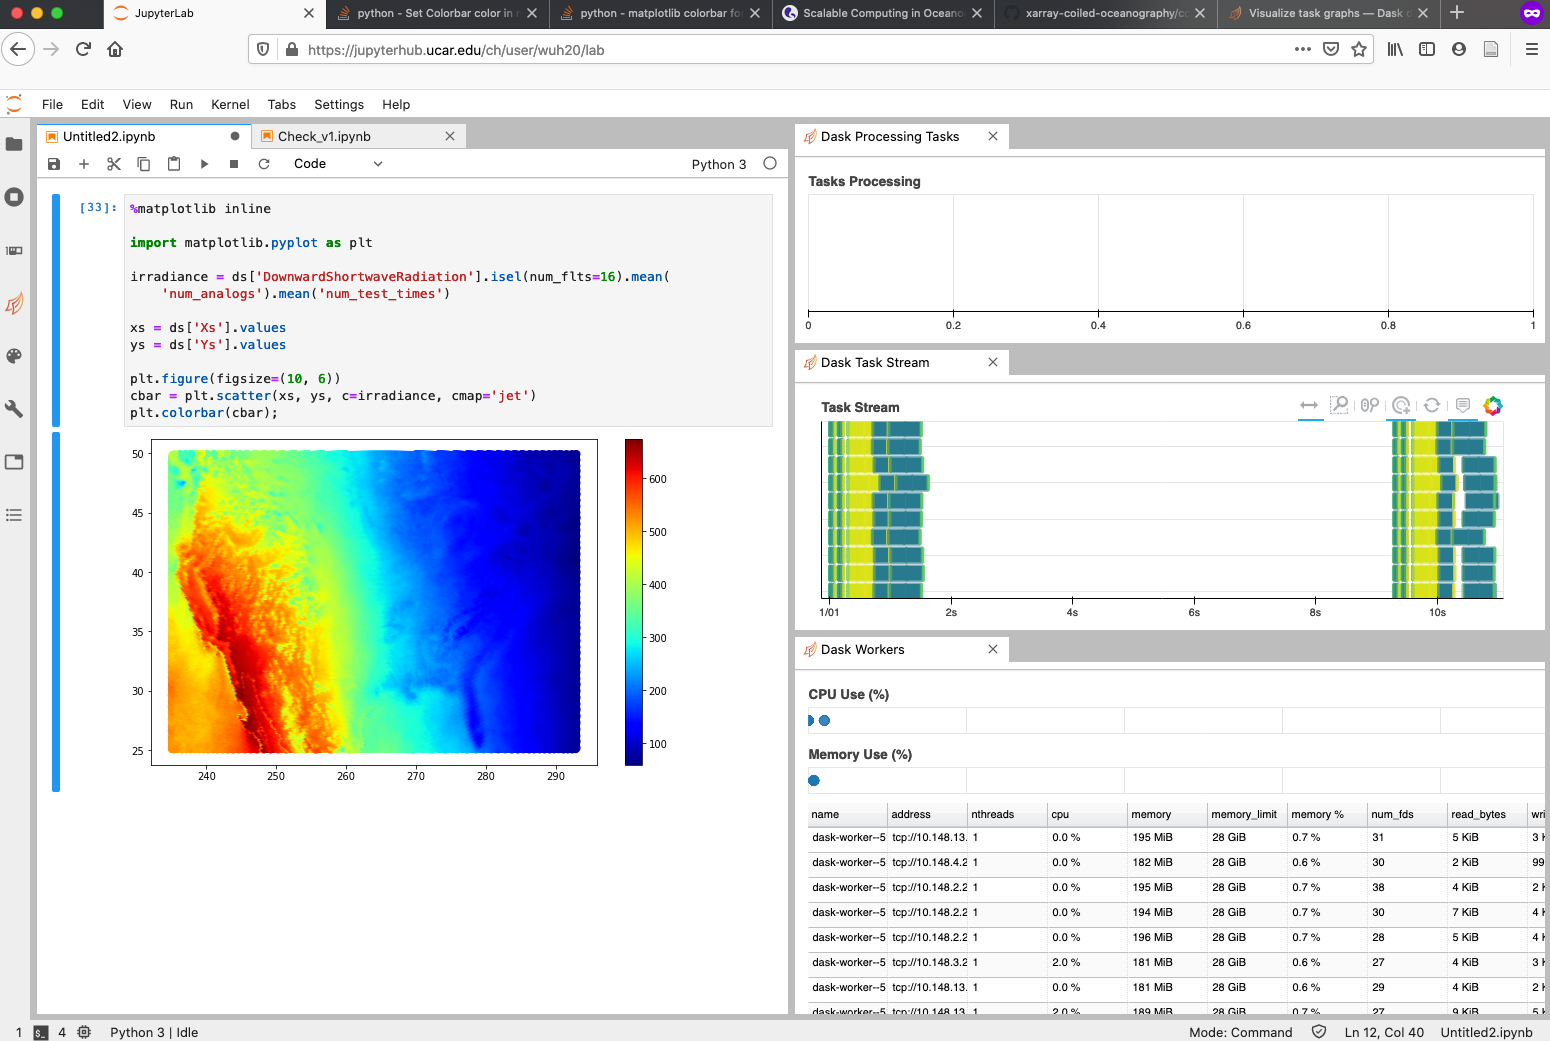
I promised you a figure and here we are going to generate one. Our data points are not on a regular mesh grid so it is hard to fit into an x-by-y grid map. I have to generate scatter plot as an alternative.
%matplotlib inline

import matplotlib.pyplot as plt

irradiance = ds['DownwardShortwaveRadiation'].isel(num_flts=16).mean(
    'num_analogs').mean('num_test_times')

xs = ds['Xs'].values
ys = ds['Ys'].values

plt.figure(figsize=(10, 6))
cbar = plt.scatter(xs, ys, c=irradiance, cmap='jet')
plt.colorbar(cbar);
And you will see a figure generated in no time. Also not the progress bars to the right.

Computation Graph
Before we wrap up, I want to document another cool feature of Dask to generate computation graph. Data are loaded in a lazy style meaning that they are loaded only when they are needed. For example, in the previous code snippet, when we create the variable irradiance, we are not actually calculating the slices and averages at that time, Daks is simply creating a computational graph representing all the operations. If you are familiar with TensorFlow or PyTorch, they are similar to tensors. No real calculations are done yet until you call plt.scatter on the data. At this point, all workers started to actually carry out the computation in parallel.
To illustrate this, we can visualize the computation graph stored in irradiance.
import dask
dask.visualize(irradiance, filename='computation-graph.svg')
Please click the image to zoom in. In total there are 30 columns corresponding to 30 processes. These processes will be distributed across and created on the 10 workers available. Each column represents the computation that is going to be carried out at evaluation time, which includes reading, slicing, and calculating the averages.
Termination
To terminate the workflow, you need to first terminate workers and then terminate Jupyter session.
- Simply shutdown all session in Jupyter to close connections to all workers
-
File -> Hub Control Panel -> Stop My Serverto terminate the Jupyter session
Make sure your jobs are not hung for some mysterious reason after your terminate everything. You can check this by running qstat -u <your user name> in a terminal on Cheyenne. Give them at least several minutes to be properly terminated.
If jobs are still running for some mysterious reasons, terminate them using qdel <job ID>.
Summary
This post documents the setup of an interactive workflow for scalable data analysis and visualization. Comments are very welcome. Please let me know if you have any questions and suggestions. Thank you for reading.
References
- Scalable Computing in Oceanography with Dask and xarray
- Talks and tutorials provided by Dask-jobqueue
- Documentation of Dask-jobqueue
- Documentation of xarray